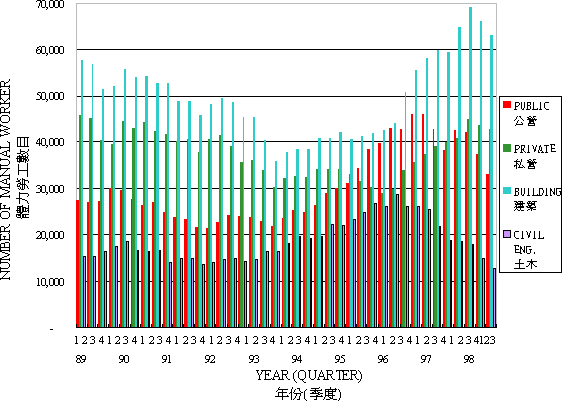
The figures for the number of manual workers engaged at building and civil engineering construction sites, analysed by sector (Public and Private) or by type of project (Building and Civil Engineering) are based on the Quarterly Report of Employment and Vacancies at Construction Sites prepared by the Census and Statistics Department.
| YEAR | QUARTER | TOTAL | ANALYSED BY SECTOR | ANALYSED BY TYPE OF PROJECT | ||
|---|---|---|---|---|---|---|
| PUBLIC | PRIVATE | BUILDING | CIVIL ENG. | |||
| 1994 | 4 | 63068 | 29073 | 33995 | 40812 | 22256 |
| 1995 | 1 | 64093 | 29943 | 34150 | 42096 | 21997 |
| 2 | 64004 | 31118 | 32886 | 40650 | 23354 | |
| 3 | 65821 | 34331 | 31490 | 41187 | 24634 | |
| 4 | 68525 | 38338 | 30187 | 41832 | 26693 | |
| 1996 | 1 | 68773 | 39673 | 29100 | 42521 | 26252 |
| 2 | 72598 | 42827 | 29771 | 43956 | 28642 | |
| 3 | 76580 | 42695 | 33885 | 50648 | 25932 | |
| 4 | 81676 | 46071 | 35605 | 55646 | 26030 | |
| 1997 | 1 | 83500 | 46016 | 37484 | 58107 | 25393 |
| 2 | 81658 | 42598 | 39060 | 59960 | 21698 | |
| 3 | 78106 | 38224 | 39882 | 59375 | 18731 | |
| 4 | 83251 | 42411 | 40840 | 64753 | 18498 | |
| 1998 | 1 | 86989 | 42042 | 44947 | 69113 | 17876 |
| 2 | 80975 | 37332 | 43643 | 66002 | 14973 | |
| 3 | 75810 | 33200 | 42610 | 63018 | 12792 | |
| 4 | 72253 | 33195 | 39058 | 61039 | 11214 | |
| 1999 | 1 | 71899 | 35508 | 36391 | 59710 | 12189 |
| 2 | 71392 | 37270 | 34122 | 59187 | 12205 | |
| 3 | 68683 | 38865 | 29818 | 56495 | 12188 | |