| YEAR | QTR | WORKS (1) | PURCHASES OF PROPERTIES (2) | TOTAL (1)+(2) | YEAR TOTAL |
|---|---|---|---|---|---|
| (ALL FIGURES ARE IN HK$ MILLION) | |||||
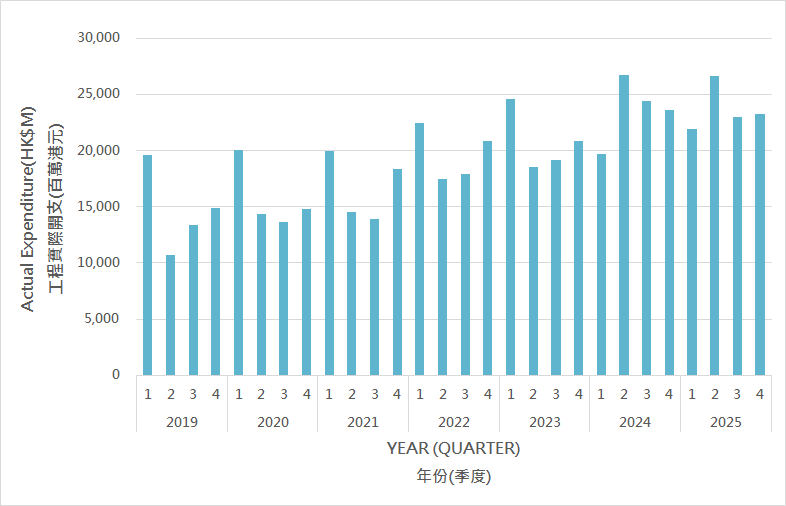
| 2025 | 4 | 23,229.0 | 4.7 | 23,233.7 | 94,800.4 |
| 3 | 22,859.8 | 112.2 | 22,972.0 | ||
| 2 | 26,646.7 | 0.0 | 26,646.7 | ||
| 1 | 21,948.0 | 0.0 | 21,948.0 | ||
| 2024 | 4 | 23,642.7 | 0.0 | 23,642.7 | 94,397.0 |
| 3 | 24,357.7 | 0.1 | 24,357.8 | ||
| 2 | 26,667.7 | 0.1 | 26,667.8 | ||
| 1 | 19,686.5 | 42.2 | 19,728.7 | ||
| 2023 | 4 | 20,803.1 | 4.7 | 20,807.8 | 82,980.5 |
| 3 | 19,090.1 | 41.4 | 19,131.5 | ||
| 2 | 18,487.7 | 0.2 | 18,487.9 | ||
| 1 | 24,561.0 | -7.6 | 24,553.4 | ||
| 2022 | 4 | 20,777.6 | 46.4 | 20,824.0 | 78,658.6 |
| 3 | 17,930.2 | 0.0 | 17,930.2 | ||
| 2 | 17,419.6 | 67.5 | 17,487.1 | ||
| 1 | 22,376.8 | 40.4 | 22,417.2 | ||
| 2021 | 4 | 18,371.7 | 3.7 | 18,375.4 | 66,832.4 |
| 3 | 13,920.5 | 0.0 | 13,920.5 | ||
| 2 | 14,551.7 | 0.1 | 14,551.8 | ||
| 1 | 19,984.8 | 0.0 | 19,984.8 | ||
| 2020 | 4 | 14,776.0 | 0.0 | 14,776.0 | 62,889.8 |
| 3 | 13,647.9 | 0.0 | 13,647.9 | ||
| 2 | 14,389.0 | 0.0 | 14,389.0 | ||
| 1 | 20,076.9 | 0.0 | 20,076.9 | ||
| 2019 | 4 | 14,861.8 | 0.0 | 14,861.8 | 58,528.4 |
| 3 | 13,350.1 | 0.0 | 13,350.1 | ||
| 2 | 10,720.8 | 0.0 | 10,720.8 | ||
| 1 | 19,595.7 | 0.0 | 19,595.7 | ||
| 2018 | 4 | 15,910.7 | 0.0 | 15,910.7 | 68,566.5 |
| 3 | 13,881.3 | 0.0 | 13,881.3 | ||
| 2 | 16,890.7 | 0.0 | 16,890.7 | ||
| 1 | 21,883.9 | 0.0 | 21,883.9 | ||
| 2017 | 4 | 20,155.8 | 0.0 | 20,155.8 | 71,399.5 |
| 3 | 17,047.8 | 0.0 | 17,047.8 | ||
| 2 | 17,098.0 | 0.0 | 17,098.0 | ||
| 1 | 21,676.1 | 0.0 | 21,676.1 | ||
| 2016 | 4 | 18,830.4 | 0.0 | 18,830.4 | 72,378.8 |
| 3 | 17,083.0 | 0.0 | 17,083.0 | ||
| 2 | 19,714.4 | 0.0 | 19,714.4 | ||
| 1 | 16,751.0 | 0.0 | 16,751.0 | ||
| 2015 | 4 | 17,705.7 | 0.0 | 17,705.7 | 71,570.7 |
| 3 | 17,255.2 | 0.0 | 17,255.2 | ||
| 2 | 18,867.7 | 0.0 | 18,867.7 | ||
| 1 | 17,742.0 | 0.0 | 17,742.0 | ||
| 2014 | 4 | 17,842.2 | 0.0 | 17,842.2 | 67,015.0 |
| 3 | 15,611.4 | 0.0 | 15,611.4 | ||
| 2 | 12,389.5 | 0.0 | 12,389.5 | ||
| 1 | 21,171.9 | 0.0 | 21,171.9 | ||
| 2013 | 4 | 15,527.2 | 0.0 | 15,527.2 | 58,695.1 |
| 3 | 14,113.4 | 0.0 | 14,113.4 | ||
| 2 | 11,627.0 | 0.0 | 11,627.0 | ||
| 1 | 17,427.5 | 0.0 | 17,427.5 | ||
| 2012 | 4 | 15,587.4 | 0.0 | 15,587.4 | 52,740.2 |
| 3 | 10,876.1 | 0.0 | 10,876.1 | ||
| 2 | 10,034.0 | 0.0 | 10,034.0 | ||
| 1 | 16,242.7 | 0.0 | 16,242.7 | ||
| 2011 | 4 | 12,228.1 | 0.0 | 12,228.1 | 46,272.6 |
| 3 | 10,571.3 | 0.0 | 10,571.3 | ||
| 2 | 9,496.8 | 0.0 | 9,496.8 | ||
| 1 | 13,976.4 | 0.0 | 13,976.4 | ||
| 2010 | 4 | 11,306.6 | 0.0 | 11,306.6 | 38,558.3 |
| 3 | 9,225.0 | 0.0 | 9,225.0 | ||
| 2 | 9,046.9 | 0.0 | 9,046.9 | ||
| 1 | 8,979.8 | 0.0 | 8,979.8 | ||
| 2009 | 4 | 7,008.4 | 0.0 | 7,008.4 | 25,302.2 |
| 3 | 6,276.2 | 0.0 | 6,276.2 | ||
| 2 | 5,615.3 | 0.0 | 5,615.3 | ||
| 1 | 6,402.3 | 0.0 | 6,402.3 | ||
| 2008 | 4 | 5,312.2 | 0.0 | 5,312.2 | 19,426.7 |
| 3 | 4,159.7 | 0.0 | 4,159.7 | ||
| 2 | 4,380.9 | 0.0 | 4,380.9 | ||
| 1 | 5,573.9 | 0.0 | 5,573.9 | ||
| 2007 | 4 | 3,927.0 | 0.0 | 3,927.0 | 16,461.1 |
| 3 | 3,695.0 | 0.0 | 3,695.0 | ||
| 2 | 3,995.0 | 0.0 | 3,995.0 | ||
| 1 | 4,844.1 | 0.0 | 4,844.1 | ||
| 2006 | 4 | 5,008.6 | 0.0 | 5,008.6 | 20,404.8 |
| 3 | 4,265.8 | 0.0 | 4,265.8 | ||
| 2 | 4,377.6 | 0.0 | 4,377.6 | ||
| 1 | 6,752.8 | 0.0 | 6,752.8 | ||
| 2005 | 4 | 5,175.0 | 0.0 | 5,175.0 | 23,529.9 |
| 3 | 5,339.0 | 0.0 | 5,339.0 | ||
| 2 | 4,685.3 | 0.0 | 4,685.3 | ||
| 1 | 8,330.6 | 0.0 | 8,330.6 | ||
| 2004 | 4 | 6,165.8 | 0.0 | 6,165.8 | 25,243.9 |
| 3 | 5,745.7 | 0.0 | 5,745.7 | ||
| 2 | 5,820.5 | 0.0 | 5,820.5 | ||
| 1 | 7,511.9 | 0.0 | 7,511.9 | ||
| 2003 | 4 | 6,547.4 | 0.0 | 6,547.4 | 25,937.2 |
| 3 | 6,334.9 | 0.0 | 6,334.9 | ||
| 2 | 6,039.9 | 0.0 | 6,039.9 | ||
| 1 | 7,009.8 | 5.2 | 7,015.0 | ||
| 2002 | 4 | 6,073.9 | 1.4 | 6,075.3 | 25,309.1 |
| 3 | 5,957.0 | 41.4 | 5,998.4 | ||
| 2 | 6,240.6 | 10.9 | 6,251.5 | ||
| 1 | 6,912.1 | 71.8 | 6,983.9 | ||
| 2001 | 4 | 6,207.7 | -0.5 | 6,207.2 | 24,080.1 |
| 3 | 5,681.5 | 0.2 | 5,681.7 | ||
| 2 | 4,201.4 | 6.1 | 4,207.5 | ||
| 1 | 7,982.0 | 1.7 | 7,983.7 | ||
| 2000 | 4 | 5,763.7 | 2.4 | 5,766.1 | 23,476.1 |
The actual expenditure of the Public Works Programme excludes that of the Hong Kong Housing Authority. The Works expenditure includes payments to contractors in respect of building and civil engineering works undertaken and project-related consultants' fees. Purchase of Properties refers to open market acquisition of completed properties.