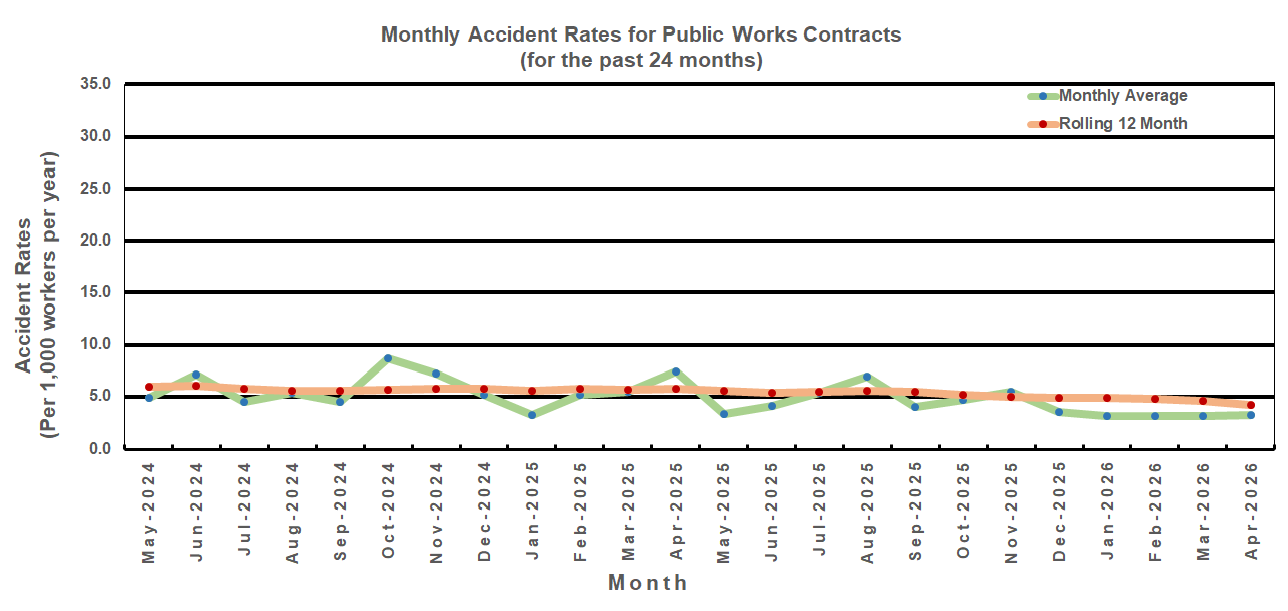
| 2024 | ||||||||||||
|---|---|---|---|---|---|---|---|---|---|---|---|---|
| Month | JAN | FEB | MAR | APR | MAY | JUN | JUL | AUG | SEP | OCT | NOV | DEC |
| Monthly Average |
5.9 | 2.3 | 7.0 | 6.2 | 4.9 | 7.2 | 4.5 | 5.3 | 4.5 | 8.7 | 7.2 | 5.2 |
| Rolling 12 Month Average |
6.4 | 6.1 | 6.2 | 6.2 | 6.0 | 6.1 | 5.8 | 5.6 | 5.6 | 5.7 | 5.8 | 5.8 |
| 2025 | ||||||||||||
|---|---|---|---|---|---|---|---|---|---|---|---|---|
| Month | JAN | FEB | MAR | APR | MAY | JUN | JUL | AUG | SEP | OCT | NOV | DEC |
| Monthly Average |
3.2 | 5.2 | 5.5 | 7.4 | 3.3 | 4.1 | 5.4 | 6.9 | 4.0 | 4.7 | 5.5 | 3.5 |
| Rolling 12 Month Average |
5.6 | 5.8 | 5.7 | 5.8 | 5.6 | 5.4 | 5.5 | 5.6 | 5.5 | 5.2 | 5.0 | 4.9 |
| 2026 | ||||||||||||
|---|---|---|---|---|---|---|---|---|---|---|---|---|
| Month | JAN | FEB | MAR | APR | MAY | JUN | JUL | AUG | SEP | OCT | NOV | DEC |
| Monthly Average |
3.1 | 3.1 | 3.1 | 3.2 | ||||||||
| Rolling 12 Month Average |
4.9 | 4.8 | 4.6 | 4.2 | ||||||||
*Figures shown in italics are provisional and may be subject to change
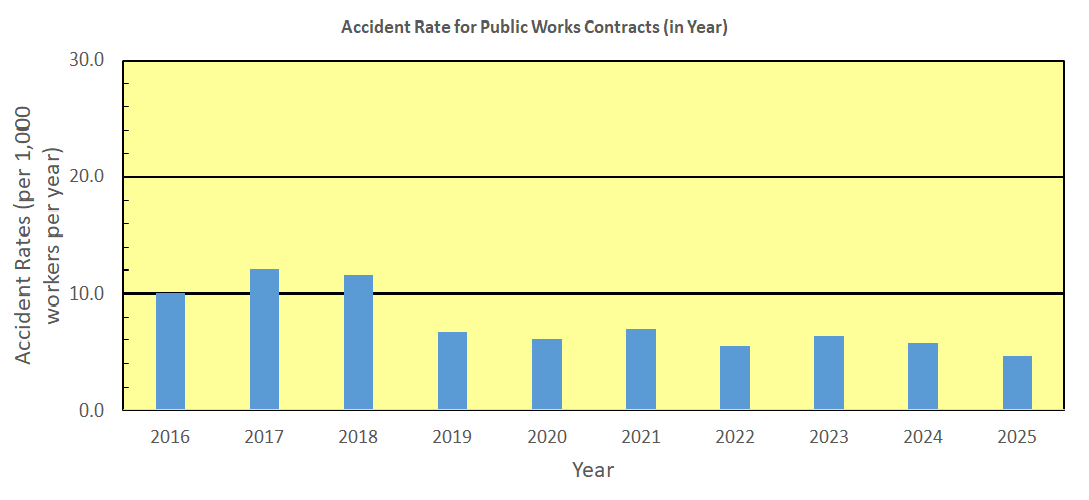
| Year | 2016 | 2017 | 2018 | 2019 | 2020 | 2021 | 2022 | 2023 | 2024 | 2025 |
| Accident Rate | 10.0 | 12.1 | 11.6 | 6.7 | 6.0 | 6.9 | 5.5 | 6.3 | 5.8 | 4.6 |