| YEAR | QTR | ||
|---|---|---|---|
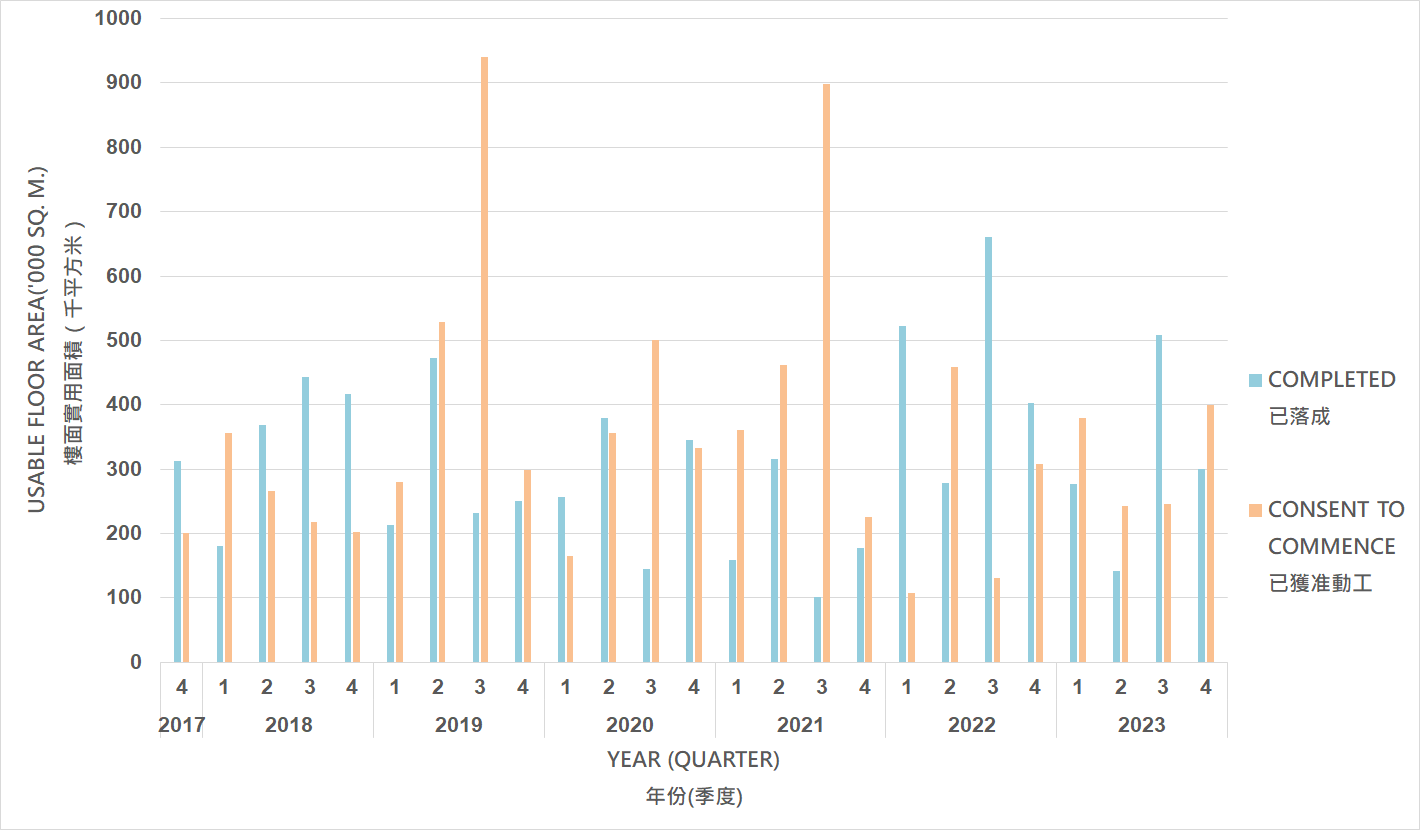
| NEW BUILDINGS COMPLETED | BUILDINGS WITH CONSENT TO COMMENCE WORK | ||
| (FIGURES IN '000 SQ. M. OF USABLE FLOOR AREA) | |||
| 2023 | 4 | 300 | 399 |
| 3 | 509 | 246 | |
| 2 | 142 | 242 | |
| 1 | 277 | 379 | |
| 2022 | 4 | 402 | 308 |
| 3 | 661 | 130 | |
| 2 | 278 | 459 | |
| 1 | 523 | 108 | |
| 2021 | 4 | 178 | 226 |
| 3 | 101 | 899 | |
| 2 | 315 | 462 | |
| 1 | 159 | 360 | |
| 2020 | 4 | 345 | 332 |
| 3 | 145 | 500 | |
| 2 | 380 | 356 | |
| 1 | 256 | 165 | |
| 2019 | 4 | 251 | 299 |
| 3 | 231 | 941 | |
| 2 | 473 | 529 | |
| 1 | 213 | 280 | |
| 2018 | 4 | 417 | 203 |
| 3 | 443 | 218 | |
| 2 | 369 | 266 | |
| 1 | 180 | 356 | |
| 2017 | 4 | 312 | 201 |
| 3 | 532 | 469 | |
| 2 | 251 | 316 | |
| 1 | 282 | 718 | |
| 2016 | 4 | 322 | 285 |
| 3 | 241 | 378 | |
| 2 | 382 | 235 | |
| 1 | 284 | 399 | |
| 2015 | 4 | 346 | 620 |
| 3 | 256 | 455 | |
| 2 | 352 | 387 | |
| 1 | 110 | 534 | |
| 2014 | 4 | 361 | 368 |
| 3 | 285 | 326 | |
| 2 | 207 | 376 | |
| 1 | 246 | 190 | |
| 2013 | 4 | 253 | 542 |
| 3 | 362 | 269 | |
| 2 | 151 | 288 | |
| 1 | 65 | 300 | |
| 2012 | 4 | 340 | 230 |
| 3 | 479 | 514 | |
| 2 | 258 | 241 | |
| 1 | 317 | 551 | |
| 2011 | 4 | 241 | 265 |
| 3 | 205 | 316 | |
| 2 | 202 | 177 | |
| 1 | 343 | 298 | |
| 2010 | 4 | 204 | 179 |
| 3 | 299 | 470 | |
| 2 | 141 | 270 | |
| 1 | 496 | 291 | |
| 2009 | 4 | 201 | 311 |
| 3 | 250 | 305 | |
| 2 | 149 | 219 | |
| 1 | 215 | 240 | |
| 2008 | 4 | 382 | 116 |
| 3 | 370 | 146 | |
| 2 | 162 | 335 | |
| 1 | 183 | 400 | |
| 2007 | 4 | 407 | 299 |
| 3 | 126 | 519 | |
| 2 | 271 | 462 | |
| 1 | 192 | 259 | |
| 2006 | 4 | 502 | 440 |
| 3 | 333 | 489 | |
| 2 | 322 | 249 | |
| 1 | 232 | 220 | |
| 2005 | 4 | 288 | 547 |
| 3 | 259 | 251 | |
| 2 | 388 | 396 | |
| 1 | 292 | 283 | |
| 2004 | 4 | 356 | 198 |
| 3 | 590 | 194 | |
| 2 | 378 | 297 | |
| 1 | 323 | 500 | |
| 2003 | 4 | 455 | 407 |
| 3 | 518 | 551 | |
| 2 | 449 | 343 | |
| 1 | 253 | 484 | |
| 2002 | 4 | 742 | 356 |
| 3 | 800 | 368 | |
| 2 | 378 | 418 | |
| 1 | 318 | 229 | |
| 2001 | 4 | 440 | 378 |
| 3 | 364 | 187 | |
| 2 | 351 | 372 | |
| 1 | 382 | 557 | |
| 2000 | 4 | 585 | 583 |
Figures for usable floor areas for buildings completed and for building projects for which consent to commence work has been given are extracted from the Monthly Statistics issued by the Buildings Department. The usable floor area is defined as the aggregate of the areas of the floor or floors in a storey or building excluding any staircases, public circulation space, lift landings, lavatories, water-closets, kitchens, and any space occupied by machinery for any lift, air-conditioning system or similar service provided for the building.